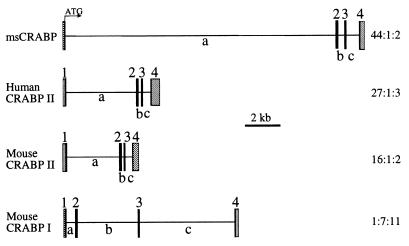
Figure 2.
Schematic diagram depicting the organization of the msCRABP gene and comparison with the three currently characterized vertebrate CRABP genes (mouse CRABP I and II and human CRABP II) (34, 38, 39). The genes are aligned at their methionine initiator codon (ATG). Exons are labeled 1–4 and introns a–c. Untranslated exon sequence is shown as stippled boxes, coding sequence as solid boxes, and introns as thin lines. Relative intron size (ratio, a:b:c) is listed to the right of each gene.

