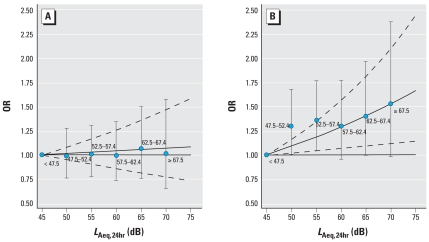
Figure 2.
ORs of hypertension in women (A) and men (B) in relation to road traffic noise (LAeq,24hr, 5-dB categories) separately included in the model. Adjusted for country, age, BMI, alcohol intake, education, and exercise. The error bars denote 95% CIs for the categorical (5-dB) analysis. The unbroken and broken curves show the ORs and corresponding 95% CIs for the continuous analysis.

