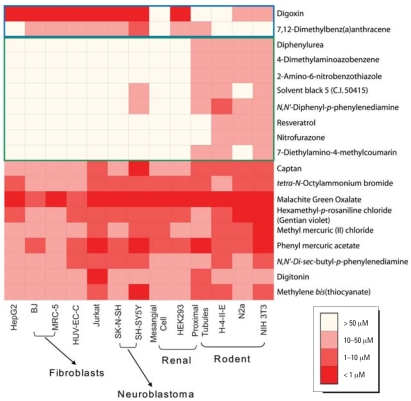
Figure 4.
Compound activity across different species. Compound activity in each cell line is colored according to potency (IC50) range. The figure shows examples of compounds that are more cytotoxic to human cells (top two rows) or to rodent cells (middle rows), and compounds with similar levels of cytotoxicity in human and rodent cells (bottom rows).

