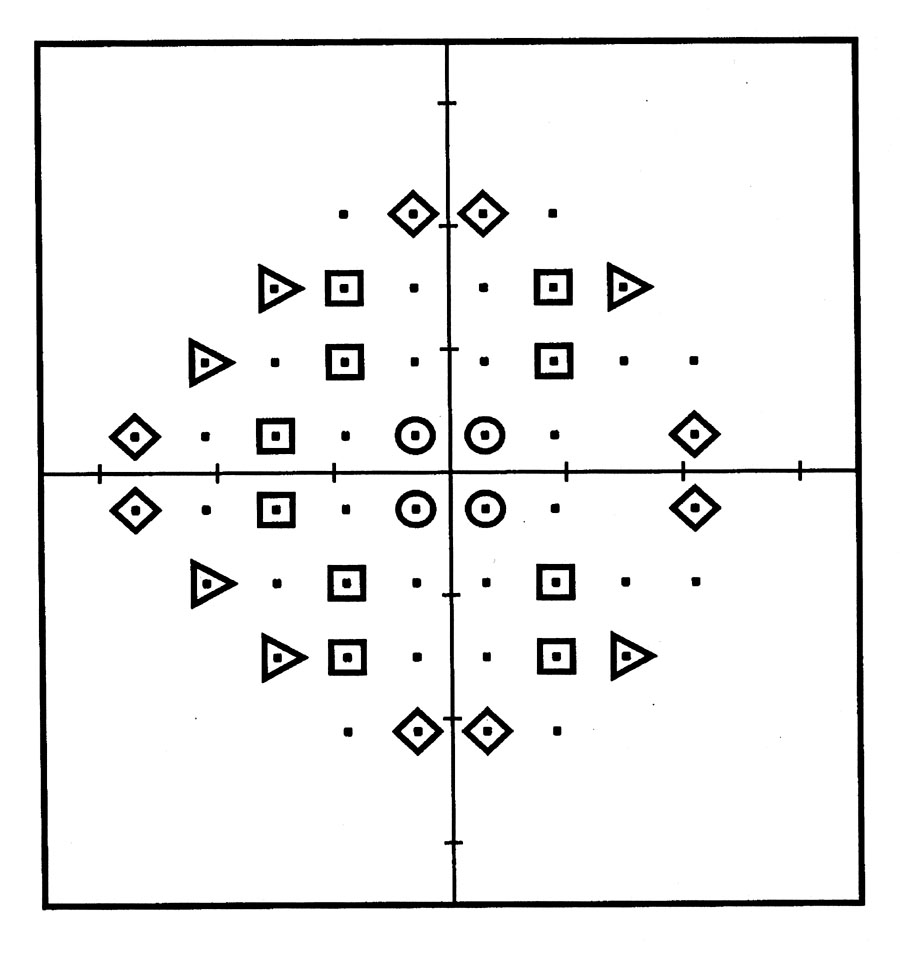
Fig. 1.

Test field locations from the Humphrey Field Analyzer C24-2 program (Carl-Zeiss Meditec, Dublin, Calif ) that corresponded to retinal locations of the tissue samples for histologic cell counts. The symbols represent the 28 sites that were used for the correlation of retinal ganglion cell density and visual field sensitivity in eyes of patients with glaucoma. The symbol shapes that are used to designate visual field locations for retinal tissue samples are also used in Figures 2 and 3 to represent the visual field and retinal locations of the data for comparing the predicted and measured ganglion cell density.
