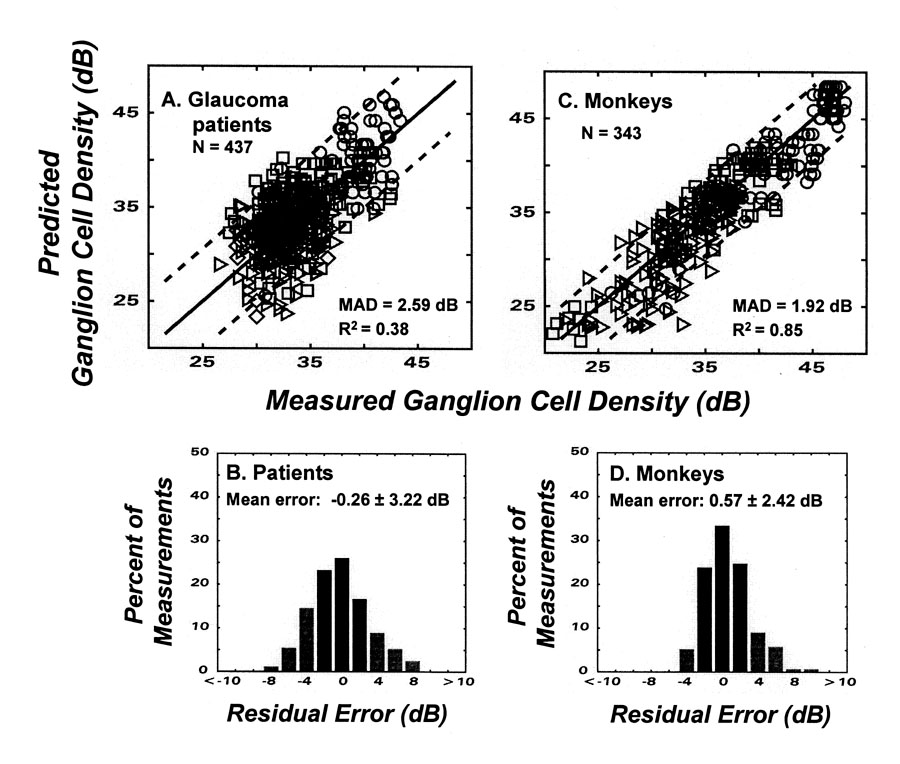
Fig. 2.

The application of the model for structure-function to glaucoma patients and monkeys with experimental glaucoma. The upper graphs (A & C) represent the relationships between ganglion cell densities predicted from perimetry measurements of visual sensitivity as a function of the histological measurements of cell density. The different symbol shapes designate different locations in the visual field, as indicated by the sites of retina samples in Fig. 1. The model prediction of unity correlation is shown by the one-to-one line that is superimposed on the data. Goodness-of-fit statistics for the mean absolute deviation (MAD) and coefficient of determination (r2) are presented as insets and the limits of agreement (95% confidence limits) are illustrated by the dashed lines on each graph. The lower histograms (B & D) present the distribution of residual errors (DRE) of the model with respect to the one-to-one relationship, with errors of greater predicted than measured cell densities designated as negative errors and errors for greater measured than predicted cell densities designated as positive errors. The mean and SD’s of the distributions are shown by insets and the percentage of errors that are less than ± 3 dB are indicated by the darker bars.
