Figure 4.

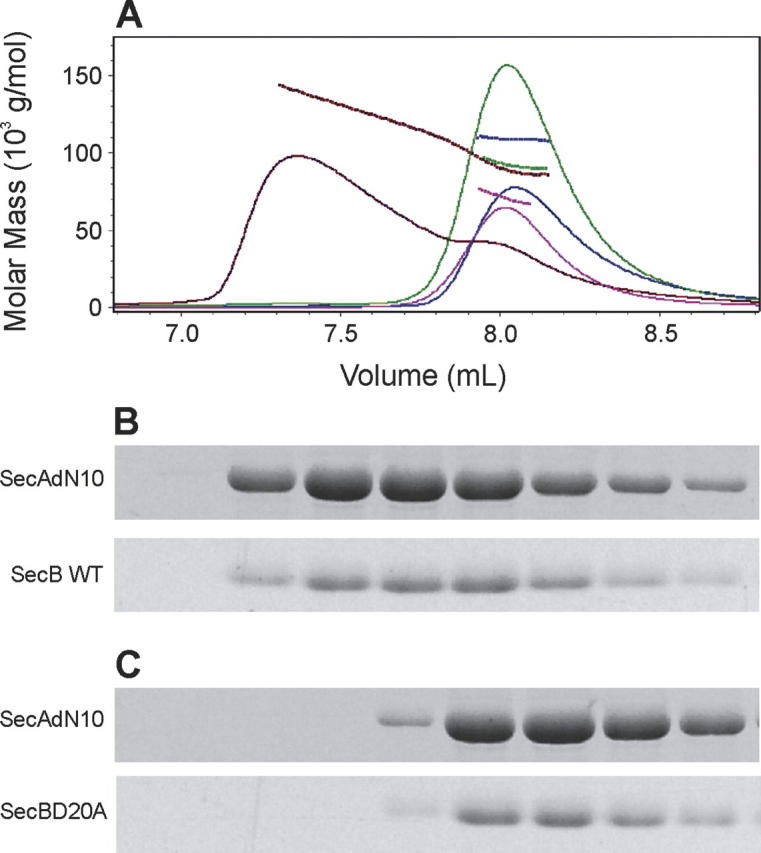
Complexes between SecA and SecB. (A) Protein mixtures were subjected to size-exclusion chromatography and the eluent was monitored to determine protein concentration by change in refractive index (solid traces) and molar mass by light scatter (dashed lines). The samples contained SecAdN10 and SecB wild type (red), SecAdN10 and SecBD20A (green), SecBD20A only (pink), or SecAdN10 only (blue). In each case SecAdN10 was applied at 12 μM monomer and SecBD20A or SecB wild type at 12 μM tetramer. The protein content of each fraction was analyzed by SDS gel electrophoresis. Fractions shown in B and C correspond to the elution profile. (B) SecAdN10 and SecB wild type, red trace in A. (C) SecAdN10 and SecBD20A, green trace in A. The positions of migration of SecAdN10 and SecBD20A or SecB wild type are indicated.
