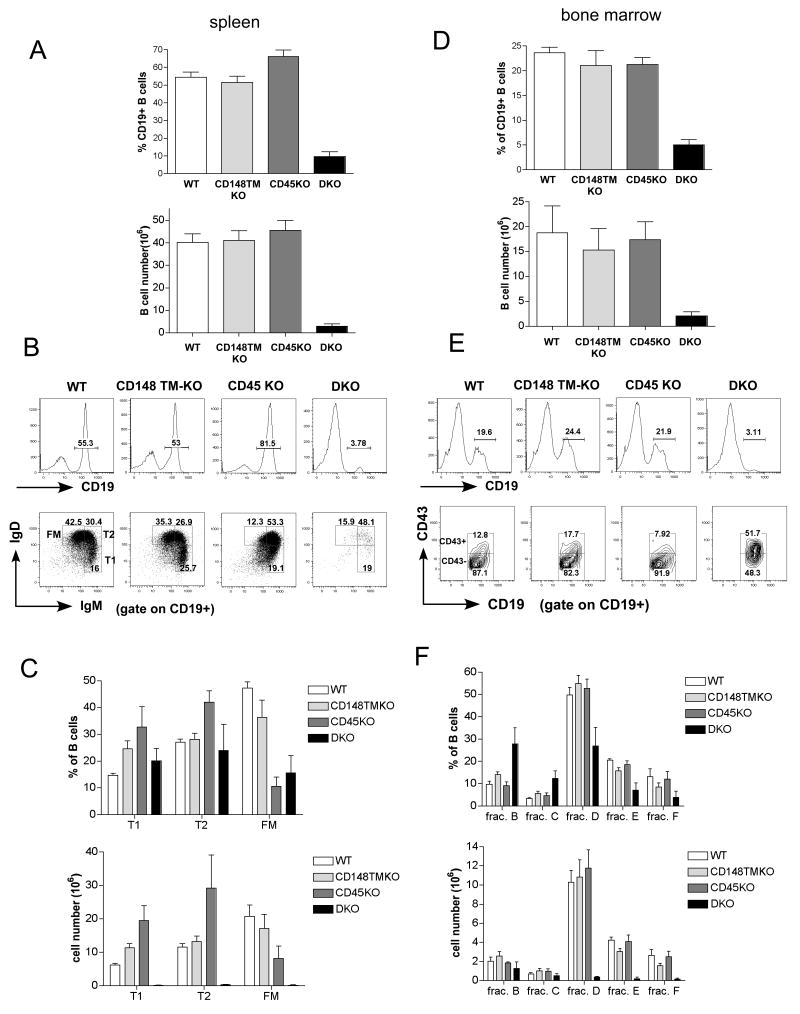
Figure 3. B cell developmental block in CD45/CD148 DKO mice on the B6 background.
(A) Percentages and cell numbers of CD19+ splenocytes from 4-6 week-old mice of the indicated genotypes. (B) Representative FACS analyses of CD19+ splenocytes stained with mAb to CD19, IgM and IgD. Percentages of CD19+ B cells, T1 (IgMhi IgDlo) cells and T2 (IgMhi IgDhi) plus follicular mature (FM) (IgMlo IgDhi) B cells are shown. (C) Percentages and absolute numbers of each B cell subset are shown. (D) Percentages and cell numbers of CD19+ lymphocytes in the BM from 4-6 week old mice of the indicated genotypes. (E) Representative FACS analyses of BM cells stained with mAb to CD19 and CD43. Percentages of CD19+ B cells and CD43- or CD43+ in CD19+ gate are shown. (F) Based on the FACS analysis, CD19+ BM B cells were identified as fraction B (CD43+ CD24+, BP1-), fraction C (CD43+ CD24+, BP1+), fraction D (CD43-IgM- IgD-), fraction E (CD43- IgM+ IgD-), fraction F (CD43- IgM+ IgD+) (see also Supplementary Fig. 2). Fraction A (B220+, CD19-) could not be analyzed due to the lack of the B220 marker in DKO mice (ND)(Hardy et al., 2000).

