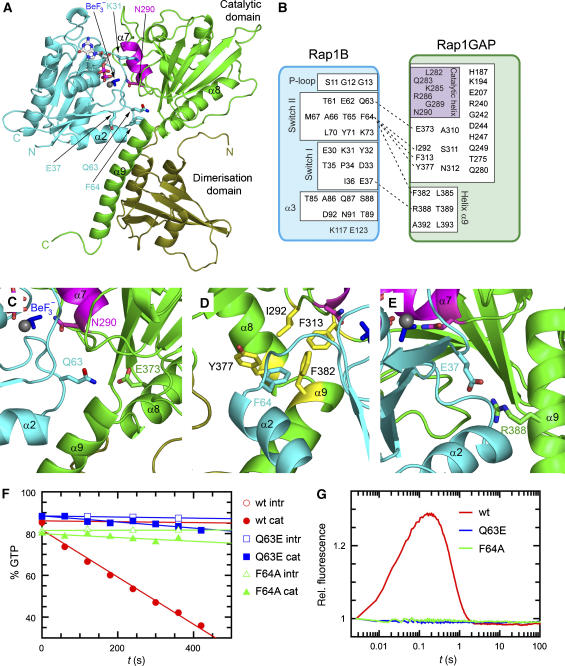
Figure 1.
Rap–Rap1GAP complex and interface analysis. (A) Ribbon representation of the Rap–GDP·BeF3−-Rap1GAP complex with Rap1B in cyan and Rap1GAP in green (catalytic domain green; dimerisation domain olive green). The catalytic helix containing the Asn-thumb (Asn290) is shown in magenta, GDP-BeF3− as ball-and-stick. (B) Schematic representation of interacting residues. Interactions shown in detail in (C–E) are depicted with a dashed line. (C–E) Structural details of interactions between Rap1B and Rap1GAP, with colours as in (A). (F) HPLC-based analysis of the Rap-stimulated GTPase reaction, with 200 μM wt and mutant Rap and 100 nM Rap1GAP. (G) Stopped-flow analysis of the interaction between 2 μM Aedans-labelled wt and mutant Rap and 50 μM Rap1GAP; reaction was followed by monitoring fluorescence through a 408 nm cutoff filter. Wt and mutant Rap contain the A86C mutation, which has been shown to behave as wild type, as described earlier (Kraemer et al, 2002; Chakrabarti et al, 2007).

