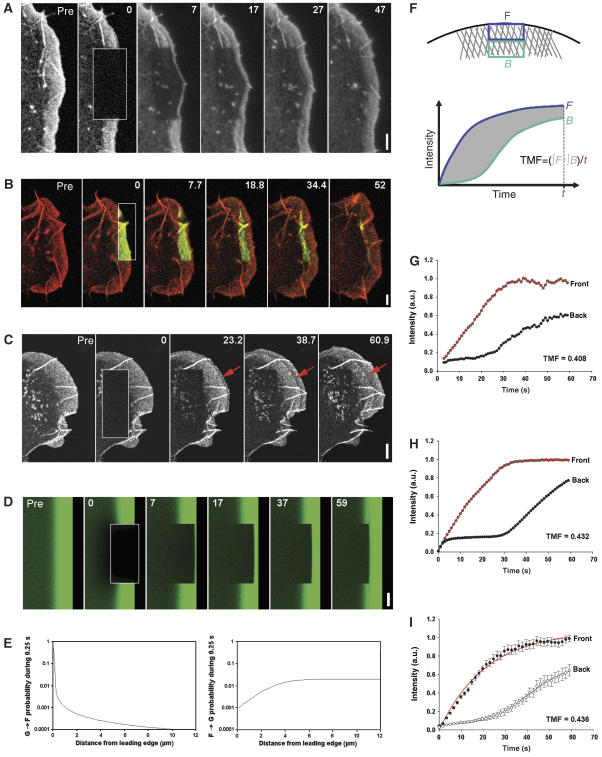
Figure 1.
Actin assembly is restricted to the lamellipodium tip. (A) FRAP of EGFP–actin in lamellipodium of B16-F1 cell bleached as indicated by rectangle. Numbers in post-bleach images correspond to seconds. Bar: 3 μm. (B) Photoactivation of PA–EGFP–actin (green) within a lamellipodial region as indicated by rectangle in cell co-expressing mRFP–actin (red). Bar: 2 μm. (C) Rapid translocation to the leading edge of EGFP–actin bleached in the lamella (rectangle). Bleached actin incorporates at the leading edge and treadmills rearwards with the actin filament network (red arrows). Bar: 2 μm. (D) Monte Carlo diffusion model of the experiment shown in (A), with actin assembly/disassembly probability profiles shown in (E). Bar: 3 μm. (E) G-to-F (polymerization) and F-to-G (depolymerization) probability as a function of distance from the leading edge assumed for the simulation shown in (D). (F) Diagram explaining TMF calculation. Average intensities of front (F) and back (B) parts of the lamellipodium are plotted over time, and differential intensity per unit time calculated as shown. (G, H) Treadmilling analyses of the experiment shown in (A) and of its simulation shown in (D), respectively. (I) Treadmilling analysis for EGFP–actin as averaged from six independent movies. Data correspond to means and s.e.m. of front and back halves of analysed lamellipodia as indicated. Linear curves correspond to best fits of averaged data.

