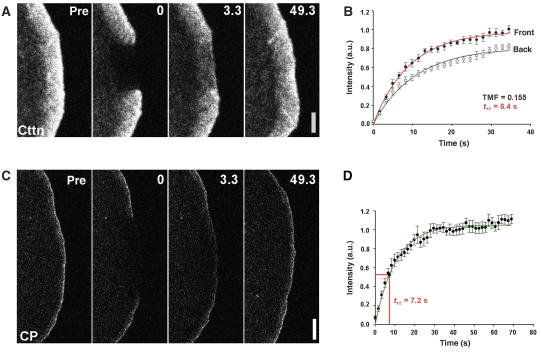
Figure 3.
Turnover of cortactin and capping protein in the lamellipodium. (A) FRAP of EGFP–cortactin (construct 1) as indicated. Time: seconds; bar: 2 μm. (B) Treadmilling analysis of EGFP–cortactin. Plotted are averaged data (means and s.e.m. of means) and best linear fits of six independent movies. The comparably low TMF is due to homogenous fluorescence recovery in the entire lamellipodium. t1/2 given was calculated for entire lamellipodium. (C) FRAP of EGFP-tagged CP-beta2, the accumulation of which is largely confined to the lamellipodium front (see also Supplementary Figure 5). Bar: 2 μm. (D) Summary of FRAP analysis for CP-beta2. Data are means and s.e.m. (eight movies) as well as best linear fit (green) of averaged data. t1/2 of fluorescence recovery was calculated from best linear fit.

