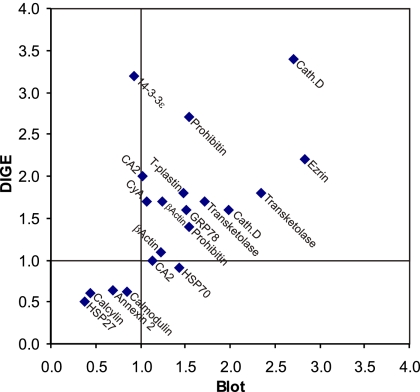
Fig. 4.
Correlation of changes in protein expression determined by DIGE analysis versus immunoblotting. The ratio of protein expression in lithium/control as determined by immunoblotting and DIGE analysis are expressed on the x axis and y axis, respectively. Proteins identified at both 1 and 2 weeks are included.

