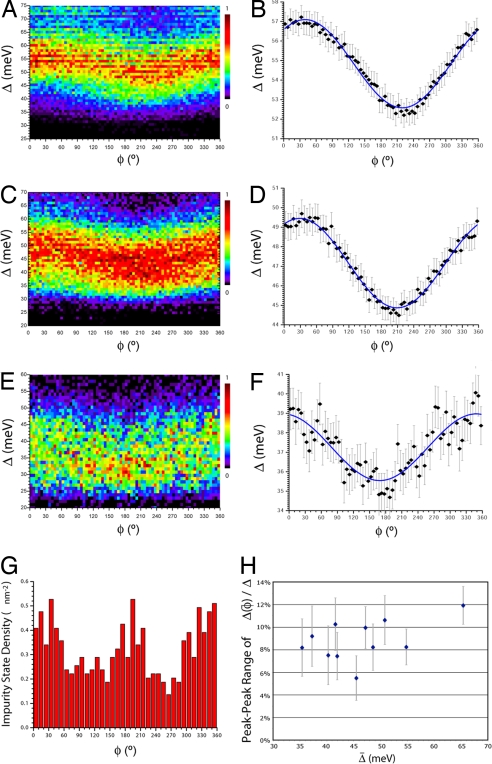
Fig. 3.
Gap magnitude as a function of crystal supermodulation phase. (A, C, and E) Two-dimensional histograms giving the frequency with which each value of Δ (in meV) occurs at a given phase of the supermodulation φ (in degrees) for the underdoped (A), optimally doped (C), and overdoped (E) samples analyzed in Fig. 2. The color scale gives the relative frequency as a fraction of the maximum. Taking any vertical cut through these two-dimensional histograms results in an approximately Gaussian-profiled one-dimensional histogram of Δ distribution for a specific value of φ. (B, D, and F) The mean value of Δ for each value of φ is plotted as a function Δ(φ) for each sample from A, C, and E, respectively. Error bars represent 95% confidence intervals. (G) Dopant impurity state density vs. supermodulation phase, showing a typical two-peaked distribution. (H) The magnitude of the supermodulation effect on gap energy is represented by the peak-to-peak range 2A of the cosinusoidal fit to Δ(φ) (expressed as a percentage of the average) for each sample studied. There is no clear relationship to the hole density.

