Fig. 5.
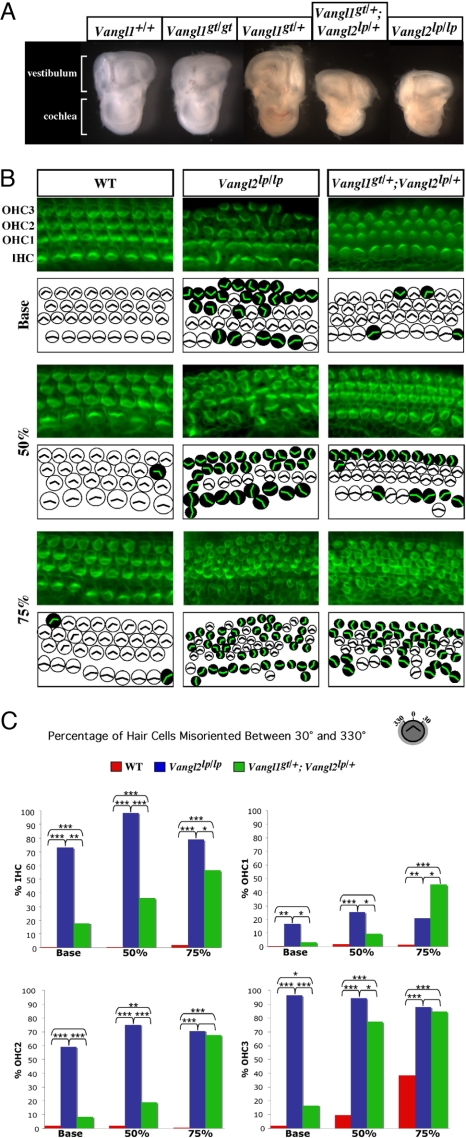
Genetic interaction of Vangl1 and Vangl2 in planar cell polarity of the neurosensory cells in the inner ear. (A) Macroanatomy of inner ear structures dissected from E18.5 embryos of various Vangl1 and Vangl2 genotypes is shown. (B) Whole-mount preparations of organs of Corti from E18.5 WT, Vangl2lp/lp, and Vangl1gt/+;Vangl2lp/+ embryos stained with phalloidin–FITC antibody to visualize actin-based stereociliary bundles. The analyzed regions were determined relative to the length of the cochlear duct. The base region was 5% from the most basal position of the cochlea, the 50% region was the midpoint between the most basal and most apical ends, and the apical region was at 75% from the most basal position. Each microscopic image is schematically depicted: White circles correspond to the hair cells with normal planar orientation of the stereociliary bundles, and the black circles correspond to the hair cells with randomized orientation of the actin vertexes. The individual layers of IHCs and OHCs (OHC1–3) are identified. (C) Quantification of the number of misoriented hair cells (as a percentage) found in embryos of different Vangl1 and Vangl2 genotypes. The asterisks indicate the level of significance (χ2 analysis): ***, P < 0.0005; **, P ≥ 0.0005 to P < 0.005; *, P ≥ 0.005 to P < 0.05. The absence of an asterisk indicates lack of significance (P ≥ 0.05).

