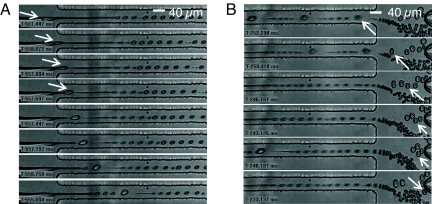
Fig. 2.
Images from video sequences of cell encapsulation obtained by high-speed videomicroscopy (negative timescale). Scale bar for each image sequence is 40 μm. Qo = 150 μl/h; Qc = 8 μl/h. (A) Jet neck breaking by the passage of a cell (white arrow), and consecutive destabilization of the jet (triggered Rayleigh–Plateau instability, see also SI Movie 1). (B) Sorting of positive droplets. The white arrow points to the mechanism by which some positive drops (generally those smaller than the average size of positive drops) can be “lost” when a series of closely spaced positive drops exits the focusing region: the positive droplet marked by the arrow is pushed down by the train of larger ones that follows it (see also SI Movie 2).

