Fig. 1.
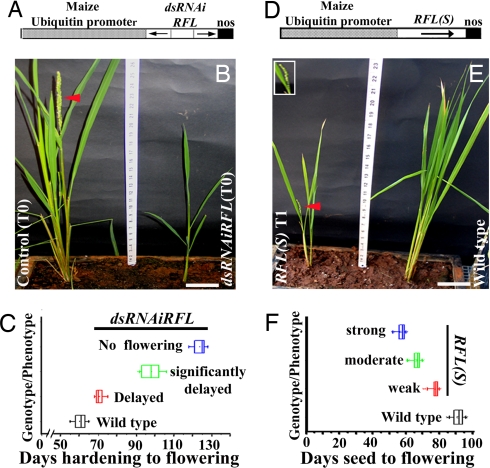
Phenotypes of RFL(S) and dsRNAiRFL plants. (A) Schematic diagram of dsRNAiRFL transgene. The ubiquitin promoter transcribes hairpin loop RNAs for RFL exon 1 and exon 2 segments. (B) Morphology of a flowering wild-type plant (Left, red arrowhead) regenerated through tissue culture and a dwarf nonflowering dsRNAiRFL (Right) plant of same age. (C) Distribution of days to flowering in dsRNAiRFL T0 plants. Flowering time (x axis) is plotted against phenotype (y axis). The statistical significance is P < 0.0001for all phenotypic groups. (D) Schematic diagram of Ubi::RFL transgene. (E) A RFL(S) plant (Left) with early panicle heading (Inset, red arrowhead with closeup), compared with a wild type of same age (Right). (F) Distribution of flowering time in RFL(S) T1 plants showing strong, moderate, and weak phenotypes.

