
Figure 2.
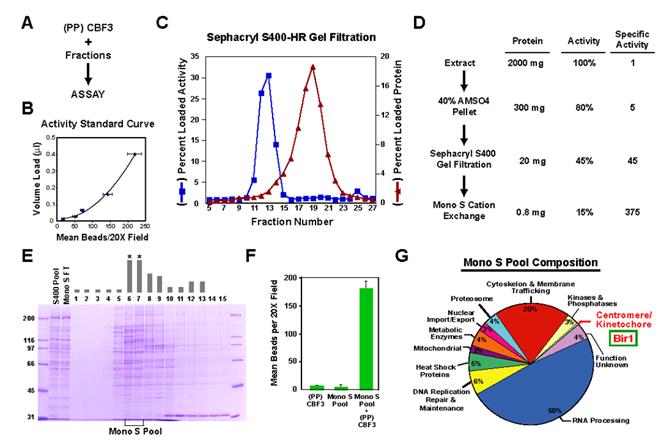
Conventional purification of an activity that complements CBF3 in the in vitro assay. (A) Schematic of the in vitro complementation approach. (B) Example of a standard curve used to quantitatively monitor fractionation of the complementing activity. The starting material, in this case the gel filtration load, is serially diluted into a constant amount of (PP)CBF3 and the points fitted to a polynomial curve. Complementing activity in each fraction measured after adding the same amount of (PP)CBF3 is converted to a percentage of total loaded activity. Error bars=SD. (C) Column profile of Sephacryl S400HR gel filtration. The percentage of loaded activity calculated from the standard curve and the percentage of total loaded protein is plotted for each fraction. (D) Summary of the complementing activity purification. The activity column lists the percentage yield, relative to the starting extract, after each step. (E) Fractions from the MonoS gradient elution stained with Coomassie Blue. The complementing activity is indicated with the gray bars above each fraction. No activity is detected in the column flowthrough. Asterisks denote the two fractions that constitute the MonoS Pool. (F) The MonoS Pool complements (PP)CBF3. Error bars=SD. (G) Annotation-based classification of proteins identified by mass spectrometry of the MonoS pool. The 247 proteins that showed >10% sequence coverage are represented in the pie chart (see also Suppl. Table 2).