Figure 8.

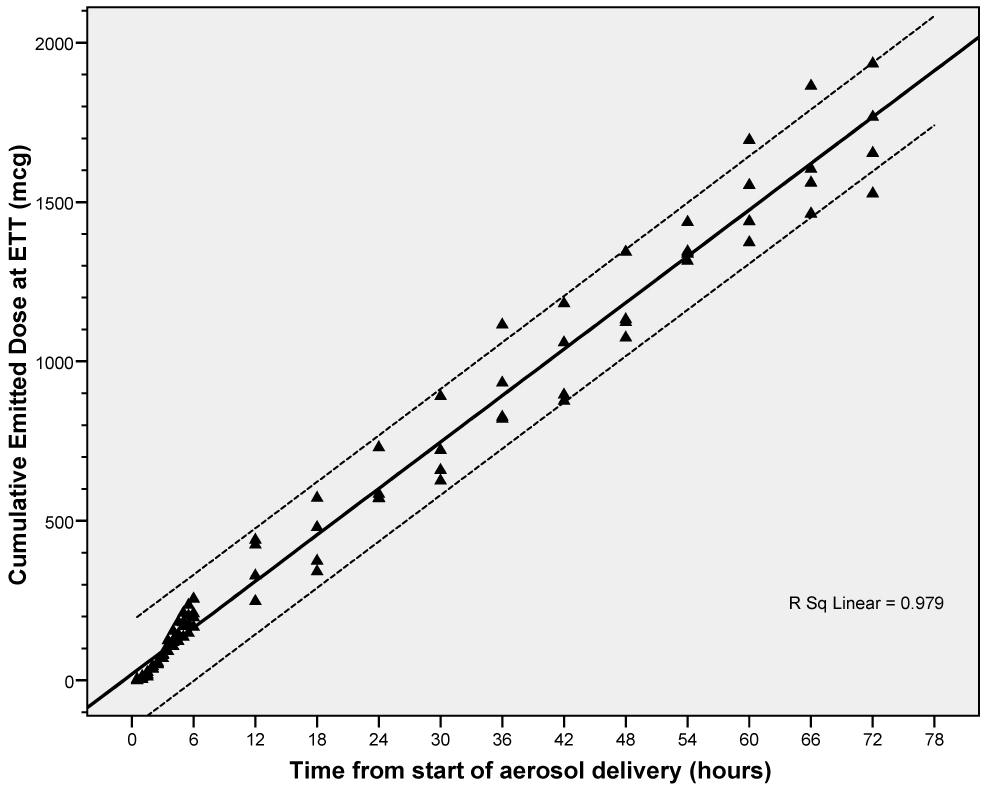
Cumulative emitted dose of PGE1 during CMV. Solid line represents best-fitting line for the data. Dotted lines represent 95% confidence intervals of the individual observations.

Cumulative emitted dose of PGE1 during CMV. Solid line represents best-fitting line for the data. Dotted lines represent 95% confidence intervals of the individual observations.