
Fig. 8.
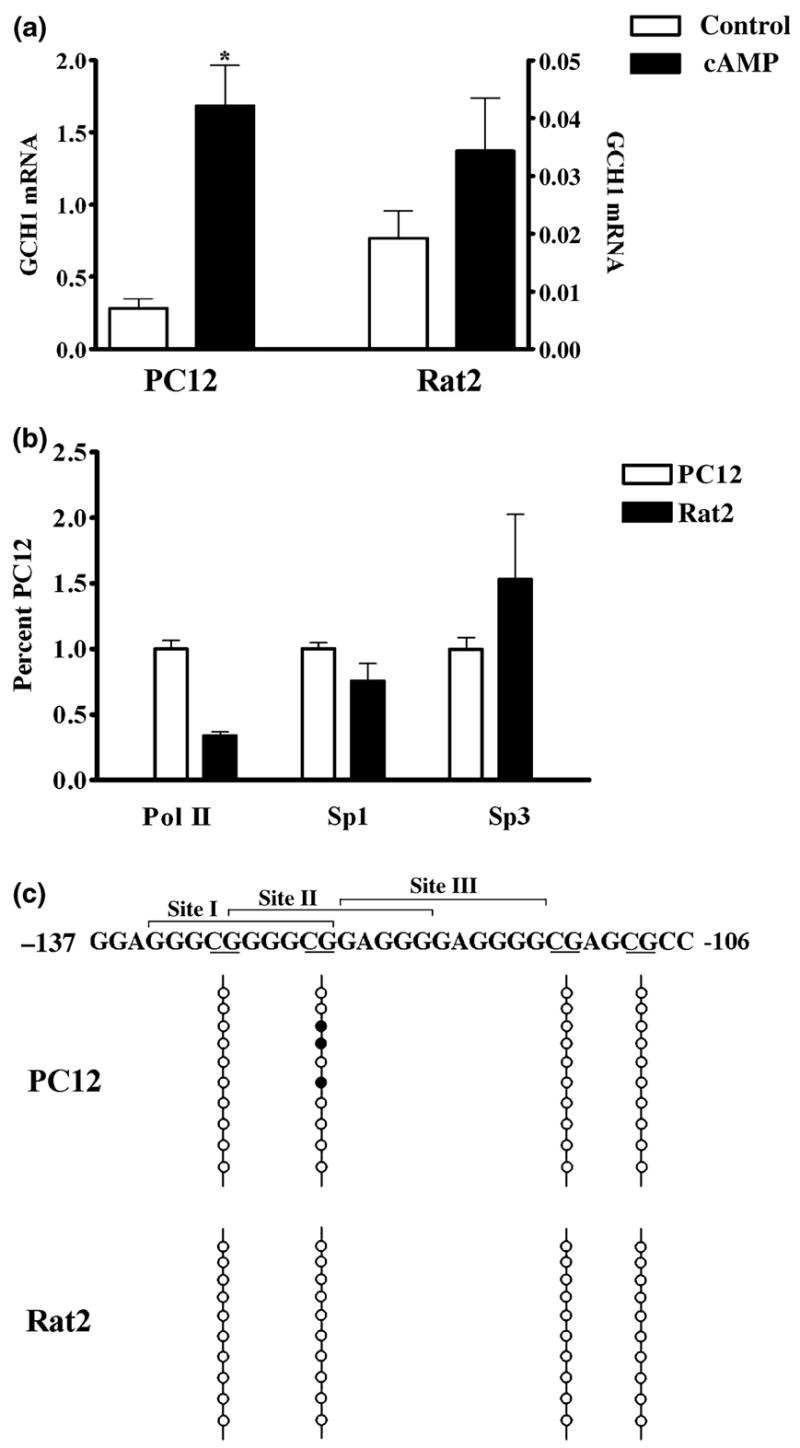
Cells that differ 10-fold in GCH1 gene expression have equal amounts of Sp1 and Sp3 associated with the native promoter and similar patterns of CpG methylation within the GC-box. (a) GCH1 mRNA levels in control cells (control) and cells treated with 5 mmol/L 8Br-cAMP for 4 h (cAMP). PC12 cells (left) and Rat2 cells (right) show 10-fold differences in basal and 47-fold differences in cAMP-stimulated transcription (note the scale change). Data were analyzed by ANOVA with post hoc Bonferroni tests (*p < 0.05 vs. PC12 control). (b) ChIP with quantitative real-time PCR analysis shows that equivalent amounts of Sp1 and Sp3 are associated with the GCH1 proximal promoter in PC12 and Rat2 cells but that significantly less Pol II is associated with the Rat2 promoter. Data are presented as percentages of values obtained for PC12 cells. Data were analyzed by ANOVA with post hoc Bonferroni tests (*p < 0.05 vs. PC12 Pol II). (c) The GCH1 GC-box showing Sites I, II, and III above and CpG dinucleotides underlined below. The four CpG dinucleotides within or adjacent to the GC-box are marked by four vertical lines. Bisulfite-treated GCH1 promoter DNA was amplified by methylation-specific PCR using primers which amplify a 288 bp product encompassing the GC-box, CRE and CCAAT-box. The ten vertical circles represent the ten PCR clones sequenced for each cell line. Filled circles represent CpG dinucleotides in which the cytosine was found to be methylated.