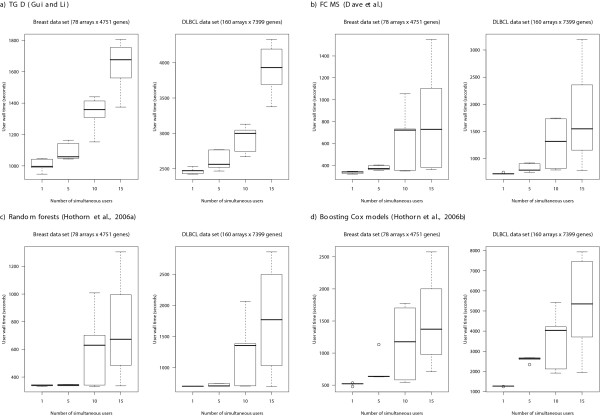
Figure 2.
User wall time of the web-based application. User wall time as a function of number of simultaneous users for two different (and real) data sets, obtained from [4]. To increase the realism of simultaneous accesses, there is delay of 5 seconds between simultaneous accesses, as might be expected, for example, from a classroom demonstration (i.e., when simulating 10 simultaneous users, the cluster is actually receiving new connections over a 10 * 5 second period, with one new connection every 5 seconds). Shown are box-plots of user wall times from several runs: 5 runs for 1 and 5 users, 10 runs for 10 users and 15 runs for 15 users. Hardware and software the same as in Figure 1.

