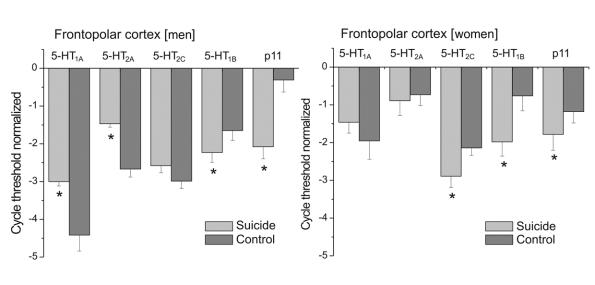
Fig. 1: Mean (and standard error of the mean) messenger ribonucleic acid (mRNA) expression of 5-HT1A, 5-HT2A, 5-HT2C, 5-HT1B and p11 in the frontopolar cortex of suicide victims who suffered from depression and of control subjects. The left panel shows the data for men, and the right panel presents the data for women. Data are presented as normalized cycle thresholds (Ctn) wherein the expression of each species was normalized by subtracting its cycle threshold (Ct) from the synaptophysin Ct. Thus a negative Ctn indicates that the mRNA species was less abundant than that of synaptophysin. A change of 1 Ctn is equivalent to a 2-fold difference in the abundance of that species. *p < 0.05 relative to control subjects of the same sex.

An official website of the United States government
Here's how you know
Official websites use .gov
A
.gov website belongs to an official
government organization in the United States.
Secure .gov websites use HTTPS
A lock (
) or https:// means you've safely
connected to the .gov website. Share sensitive
information only on official, secure websites.
