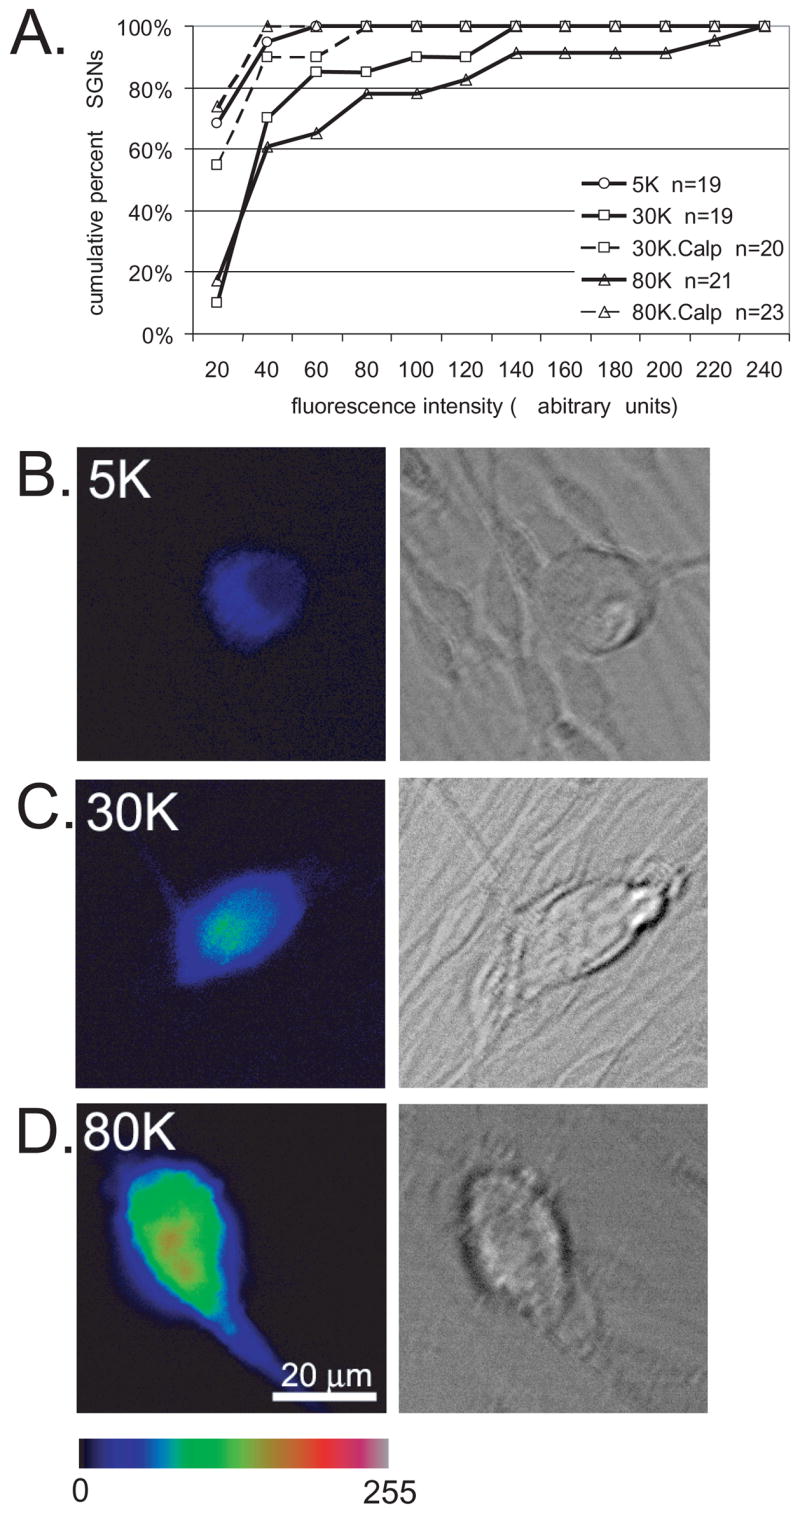
Figure 8.

Calpains are activated by depolarization in SGNs. A. Spiral ganglion cultures were loaded with the fluorogenic calpain substrate t-BOC and maintained in control medium (5K) or depolarized with 30K or 80K either in the presence or absence of calpeptin (Calp,10 μM) as indicated. After 15 minutes, images of 15–25 randomly selected SGNs were captured. t-BOC fluorescence intensity was determined by measuring intensity from the neuron cell body after subtracting the background from a similarly sized adjacent region outside the cell body. Fluorescence intensity units are arbitrary. Data are presented as a cumulative histogram and are from one trial. Similar results were obtained in 2 other repetitions. n=number of SGNs scored for this repetition. 30K and 80K are significantly different (p<0.05) from 5K and from 30K+Calp and 80K+Calp, respectively by Kruskal-Wallis ANOVA on Ranks followed by a Dunn’s post-hoc comparison. B–D. Representative images of t-BOC fluorescence (left panels) from SGNs identified based on DIC appearance (right panels) for cultures in 5K (B), 30K (C), or 80K (D). t-BOC fluorescence is presented on an intensity scale of 0–255. Scale bar=20 μm.
