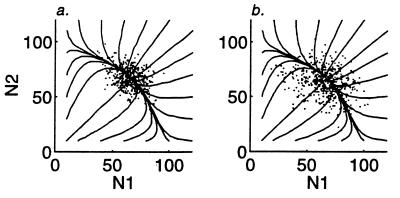
Figure 2.
Simulations of the model where the abundance of each species is perturbed at each time step (σz2 = 8). The curves show the trajectories of the nonlinear model without perturbations (Eq. 1). The dots represent the abundances of both species at 200 time steps. The community in (a) (r0 = 1) is more stable than (b) (r0 = 0.3) in terms of both biomass and population stability.

