Figure 3.
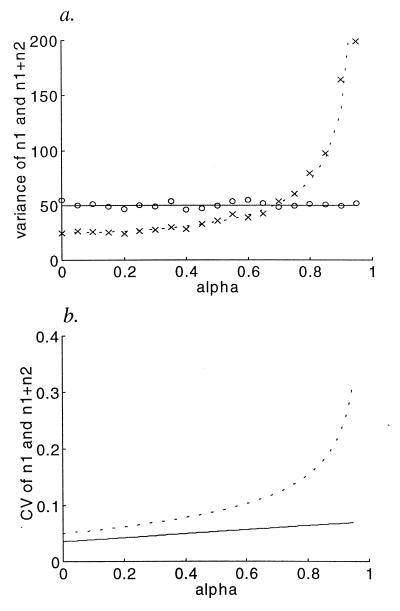
The symmetric case σz2 = 5; r0 = 1). (a) The variance of n1 + n2 (solid line) and n1 (dashed line), as a function of the α coefficient. Calculations of the variance from a simulation of the original Lotka-Volterra model agree with the results of the linear approximation [each point is variance after 1,000 time steps; variance of N1 + N2 (o), variance of N1 (x)]. (b) The CV of n1 + n2 (solid line) and n1 (dashed line), as a function of the α coefficient (K1 = K2 = 100).

