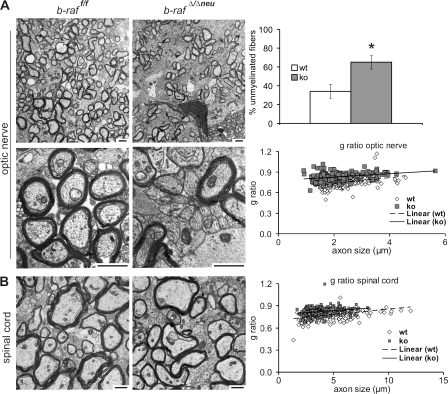
Figure 3.
Hypomyelination in the CNS of the of b-rafΔ/Δneu mice. Electron micrographs of P18 optic nerves (A) and spinal cords (B) in cross section. Note the high proportion of unmyelinated axons (plotted on the right as mean ± SD for the optic nerve; *, P < 0.05 comparing b-raf f/f and b-raf Δ/Δneu mice) and the thinner myelin sheaths in b-raf Δ/Δneu sections. The scatter plots show g ratios (diameter of the axon proper:outer diameter of the myelinated fiber) as a function of axon diameter for optic nerve and spinal cord (100 axons/mouse, three b-raf f/f, and three b-raf Δ/Δneu mice). White symbols indicate WT and gray symbols indicate b-raf Δ/Δneu mice. g ratios are higher in the b-raf Δ/Δneu mice (P < 0.0005), which indicates hypomyelination. Bars, 2.5 μm.

