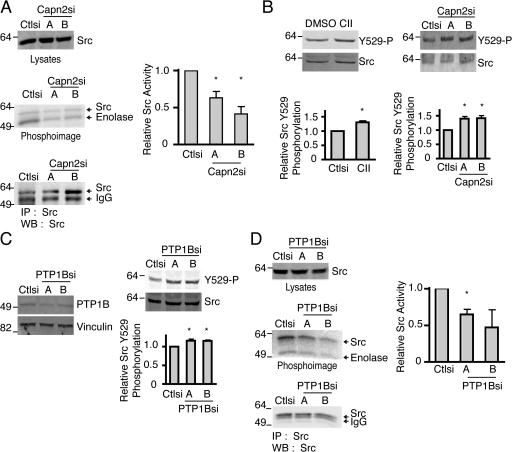
Figure 6.
Calpain 2 and PTP1B regulate Src kinase activity and phosphorylation on tyrosine 529 in MTLn3 breast cancer cells. (A) Lysates from MTLn3 cells expressing control or calpain 2 siRNA were probed for total Src expression. Immunoprecipitations were performed on lysates from MTLn3 cells stably expressing control or calpain 2 siRNA using Src-specific antibodies. Kinase activity assays were performed and the autoradiograph is shown. Quantification of Src activity relative to total Src in either control or calpain 2si lysates from three separate experiments ± SEM is shown. Asterisks indicate statistical significance compared with control based on t test (P < 0.01). (B) MTLn3 cells stably expressing control or calpain 2 siRNA were analyzed by immunoblotting and probed for total Src and phospho-Y529. As a positive control, wild-type MTLn3 cells were treated with 200 nM CII, a cell-permeable PTP1B inhibitor, or vehicle before lysis. Quantification of phospho-Y529 levels normalized to total Src ± SEM of three independent experiments is shown. Asterisks indicate statistical significance compared with control based on one-way ANOVA (P < 0.05). (C) Cell lysates from MTLn3 cells stably expressing control or PTP1B siRNA were analyzed by Western blotting and probed for calpain 2 and vinculin as a loading control. PTP1Bsi cell lysates were analyzed by immunoblot and probed for total Src and phospho-Y529. Quantification of phospho-Y529 levels normalized to total Src ± SEM of three independent experiments is shown. Asterisks indicate statistical significance compared with control based on one-way ANOVA (P < 0.05). (D) Src expression was analyzed by Western blotting in control and PTP1Bsi cells. Immunoprecipitations were performed as described in A on PTP1Bsi cells. Kinase activity assays were performed and the autoradiograph is shown. Quantification of Src activity relative to total Src in either control or PTP1Bsi lysate from three separate experiments is shown as the means ± SEM. The asterisk indicates statistical significance compared with control based on a t test (P < 0.05). Numbers to the left of gel blots indicate molecular mass standards in kD.

