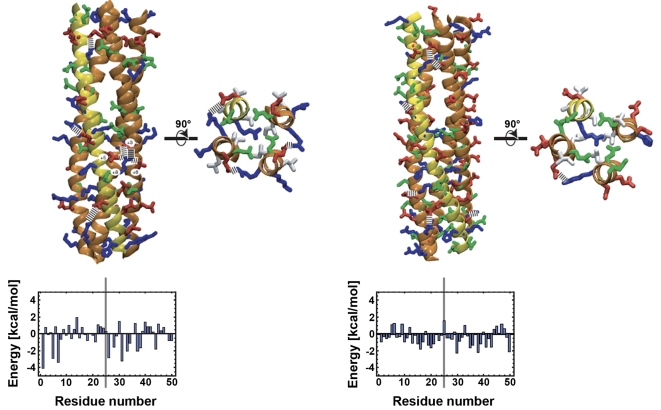
Figure 7. IncA SNARE-like motifs fit in the structure of the SNARE complex.
Side view of the complex of three motifs Cter from C. trachomatis IncA with the SNARE motif of Vamp8 (left) and of the endosomal SNARE complex [23] (right), with top view of the central layer for both complexes. The backbone of the helices is shown in orange for IncA and yellow for Vamp8. Dashed lines indicate favorable electrostatic interactions. Acidic residues (Asp, Glu) are shown in red, basic residues (Arg, Lys, His) in blue, and other polar residues (Asn, Glu) in green; in the top views hydrophobic residues are shown in white, and all other residues are left out for clarity. The energetic profiles at the bottom are estimates of the total contribution of a residue to the stability of the complex, averaged over the four helices (see Materials and Methods). The vertical line indicates the position of the central layer. Negative energy indicates that a residue is predicted to stabilize the complex, positive energy that it destabilizes the complex.

