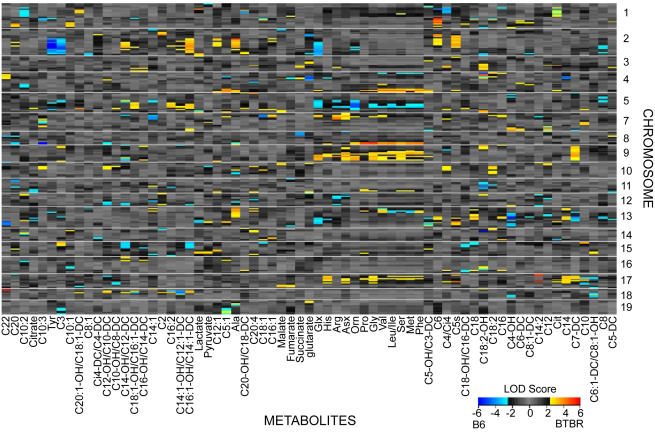
Figure 2. Linkage hot spots for metabolic quantitative trait loci (mQTL).
Each row represents a marker; each column represents a metabolite. Metabolites are ordered as in hierarchical clustering using the distance function 1-correlation (as in Figure 1). The LOD color scale is indicated, showing blue (red) when the B6 (BTBR) allele at that marker results in an elevated level of metabolite.

