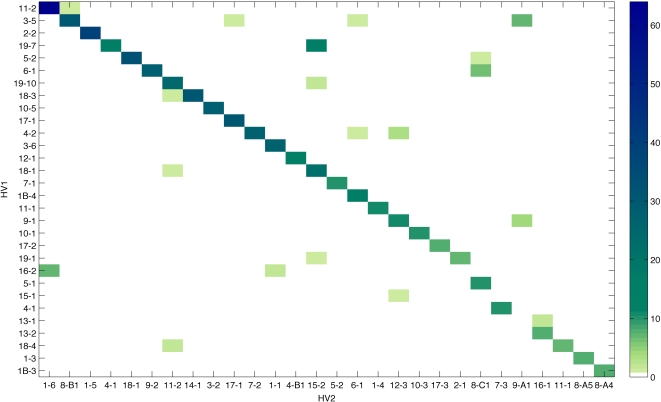
Figure 3. The combination of HV1-HV2 epitopes occurring in all carried isolates from the Czech Republic between March and June of 1993, presented as a heatmap.
HV1 and HV2 epitopes are classified into alleles as described in the Materials and Methods section. The colours indicate the total number of observations of each particular combination. Each opa locus is treated independently, so each isolate can contribute more than one combination. (See Text S1 for an alternative representation of the data).

