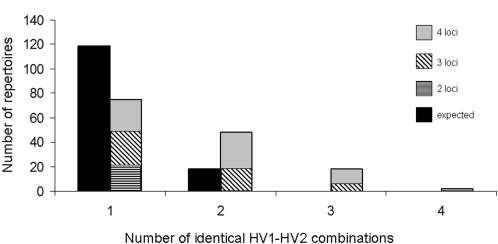
Figure 4. Observed and expected numbers of Opa loci per repertoire with identical HV1-HV2 combinations.
Only unique repertoires were included, in order to control for prevalent repertoires, and the x-axis shows how many of these loci have identical HV combinations. The ‘random’ distribution was generated using the same number of HV combinations found in the data, and these were randomly distributed among isolates. Note that the deviation from the data would be even greater if the HV combinations were truly randomized, ie. if all combinations had the same probability of occurring in a given repertoire. The observed number of isolates with two or more of the same HV combination departs significantly from the expected number (p<0.0001).

