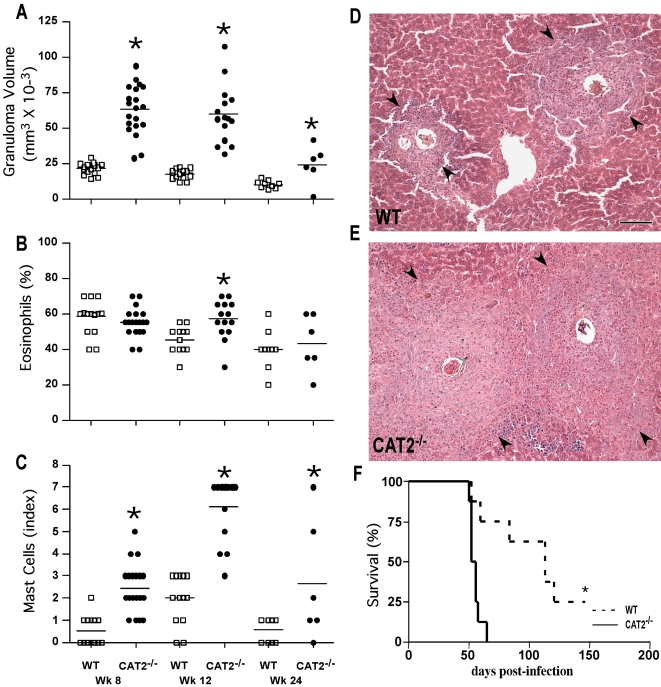
Figure 2. CAT2−/− mice display increased granulomatous inflammation in the liver following infection with S. mansoni.
WT C57BL/6 (open squares) and CAT2−/− (filled circles) mice were infected with 30–35 S. mansoni cercariae and sacrificed on wks 8, 12 and 24 post-infection. The results shown are for individual mice pooled from 3 separate experiments. A. Liver granuloma volumes measured microscopically at 8, 12 and 24 wks post-infection. The * symbol denotes significant differences between WT and KO mice at that time point, p<0.05. B. Percentage of liver granuloma-associated eosinophils (% of total cells). C. Liver granuloma-associated mast cells (Scale 1–8). D. Representative granulomas from an infected WT C57BL/6 mouse (wk 8 post-infection). Arrows indicate the perimeter of an individual granuloma with the miracidium containing egg in the center. The bar in panel 2D = 200 microns. E. Representative granulomas from an infected CAT2−/− mouse. F. % Survival after infection with 100 cercariae. p<0.001.

