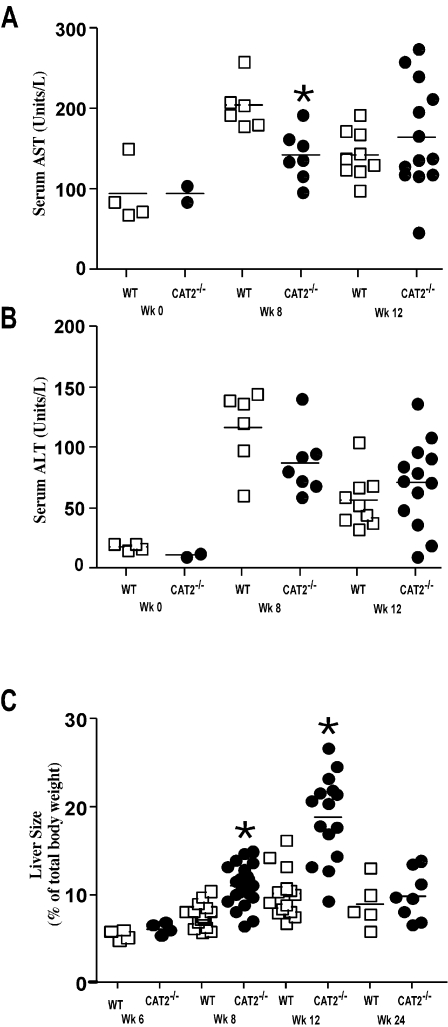
Figure 4. S. mansoni infected CAT2−/− mice develop marked hepatomegaly.
A. Serum aspartate transaminase (AST) values in WT C57BL/6 and CAT2−/− mice (wk 0, 8, 12 post-infection). The * symbol denotes significant differences between WT and KO mice at that time point, p<0.05. B. Serum alanine transaminase (ALT) values. C. Liver size as percentage of body weight at 6, 8, 12, and 24 wk post-S. mansoni infection.

