
Figure 7.
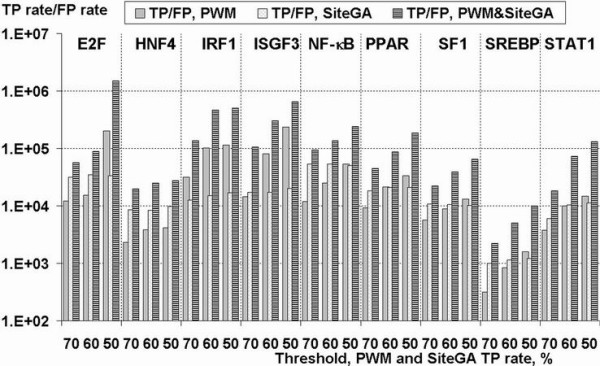
Ratios between true positive (TP) and false positive (FP) rates calculated respectively on the basis of training and background data for SiteGA, PWMs and combined PWM & SiteGA approach. X-axis – TF types and stringencies in terms of fixed TP rate (50, 60 and 70% for SiteGA and PWMs); Y-axis (logarithmic scale) – ratios of frequencies of predictions for the train (TP) to those for background set (FP). Combined approach implied that both PWM and SiteGA models recognized a potential site.