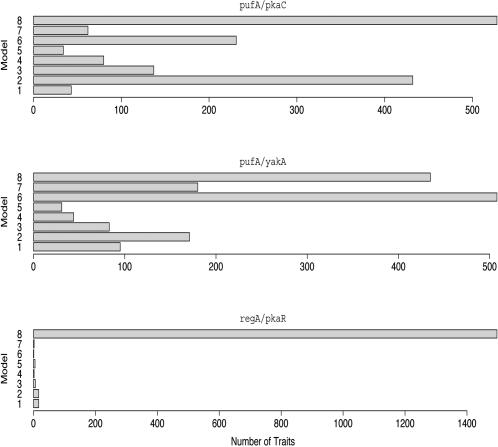
Figure 2. Post-Aggregation Distribution of Best-Fit Models at p<0.01 Significance Threshold.
The frequency distribution of best-fit regression models can be interpreted as hierarchical relationships between genes. Model 8 corresponds to no deletion effects and is supported by a large number of traits in each contrast; these genes are likely not downstream of the deletions. The model supported by the majority of remaining traits is assumed to represent the true relationship.

