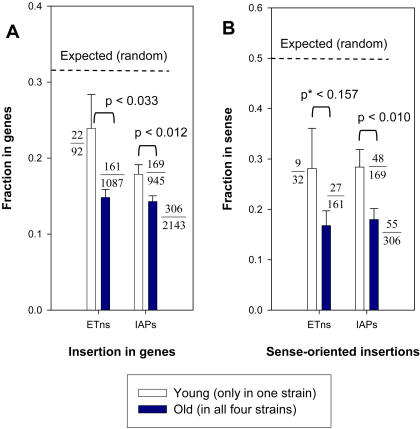
Figure 3. Distributions of young versus older ERV elements with respect to genes.
A) Fraction of elements located within genes. B) Fraction of genic elements oriented in the same transcriptional direction as the gene. Dark blue bars represent elements found in all four strains. White bars represent ERVs present in only one of the four strains. Dashed lines indicate the expected fractions assuming a random genomic integration pattern. Error bars show standard errors, and P-values based on two sample z-test comparing young and old groups are shown. All comparisons between the “young” and “old” subsets are statistically significantly different except for the orientation bias of ETn/MusD elements (marked with “*” in Figure 3B), due to the low numbers of elements in this category. Actual numbers of elements in each category are shown as numerators in fractions, with denominators being the total numbers of elements in the different groups.

