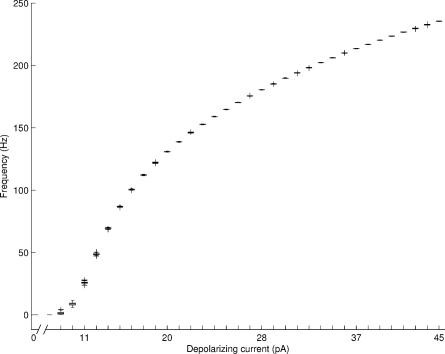
Figure 3. Frequency-current (f-I) curve of the stochastic granule cell model presented as a box and whisker plot.
Depolarizing current pulses from 0 pA to 45 pA are used. For each value of depolarizing current we simulated 50 realizations, each 50 seconds long. Median, upper and lower quartiles, and the maximal and minimal firing frequencies are given for each depolarizing current pulse; outliers are marked with+symbol. Spontaneous activity is observed at low firing frequencies with depolarizing currents below 11 pA which is the firing threshold of the model. The f-I curve of the stochastic model is linear up to a frequency of 125 Hz, after which it shows saturation. For every realization σ = 0.5.

