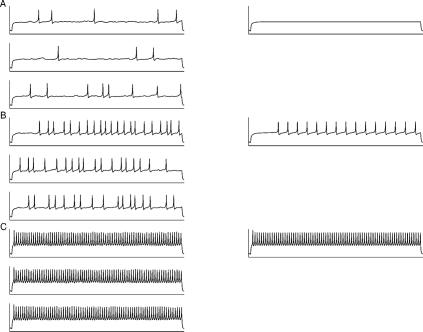
Figure 6. Comparison between the responses obtained by the deterministic and stochastic models.
The length of each trace is 0.4 seconds. In A) the depolarizing current is below firing threshold (Iapp = 11 pA) and in B) just above firing threshold (Iapp = 12 pA). In C), the depolarizing current is considerably larger (Iapp = 29 pA). The deterministic model (right panels) does not reproduce the experimentally observed irregularity in firing. The responses simulated by the stochastic model (left panels), on the contrary, very closely resemble the experimentally obtained irregularities (for more details, see the Electroresponsiveness Obtained by the Stochastic Model Only section). For the stochastic traces σ = 0.5. For each value of the depolarizing current, Iapp, traces from three independent simulations of the stochastic model are shown to illustrate the variability of firing.

