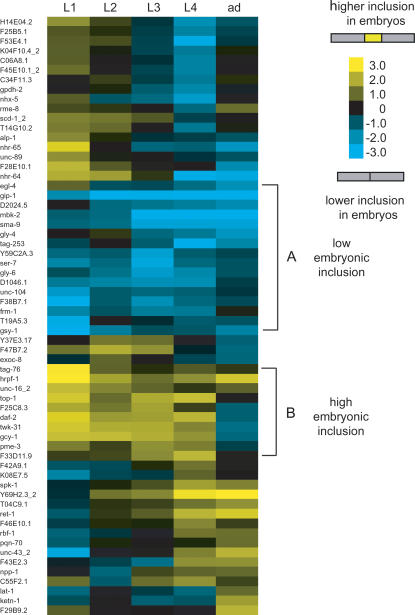
Figure 2. Cluster of top changes.
AS ratios showing greater than four-fold differences during development were clustered using hierarchical clustering and TreeView [68],[69]. Positive AS ratios correspond to cassette exons with higher inclusion in embryos, negative AS ratios correspond to higher inclusion in any of the other stages. A and B are two clusters of events with lower and higher inclusion in embryos respectively.

