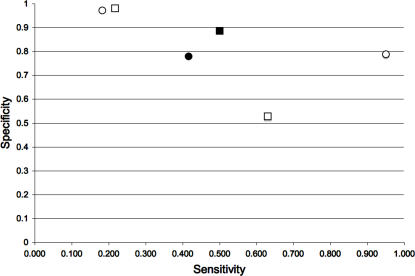
Figure 1. Residue centrality as a marker for protein conformational diversity.
The sensitivity and specificity for predicting critical residues are plotted for 2 well-characterized proteins: HIV-protease (squares) and the T4 lysozyme (circles). The empty symbols correspond to the values obtained with a single protein conformer and the shadowed symbols correspond to those obtained with multiple conformers. For comparison, the filled symbols correspond to the values obtained with conserved residues predicted as critical residues (see Methods).

