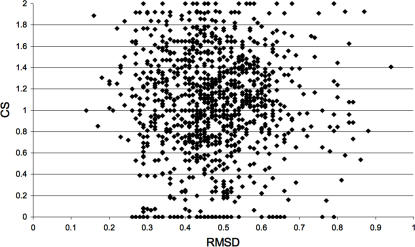
Figure 4. Mapping the relationship between RMSD and centrality in crystallographic conformers.
Combined Sensitivity (CS) is plotted against the Root Mean Square Deviation (RMSD) values observed for every pair of structures compared. 31 HIV-1 protease structures in complex with a substrate were compared against 42 HIV-1 protease structures without a substrate. Please refer to Methods for the PDB codes of the structures used in this comparison.

