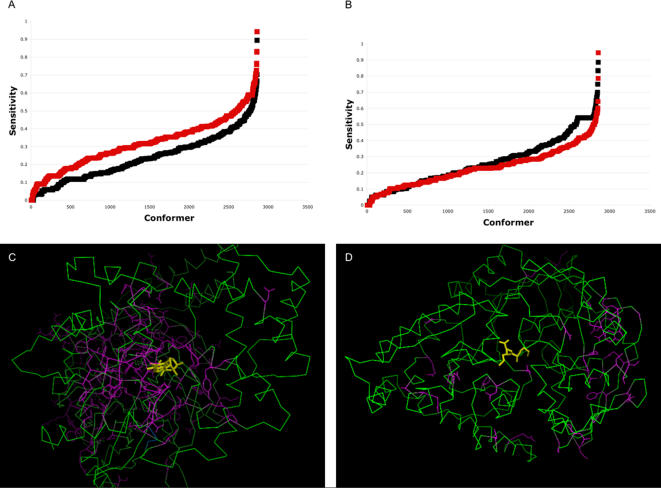
Figure 8. Mapping functional conformers in the MolMov set by centrality measurements.
The sensitivity value for predicting critical residues in the MolMov set (see Methods) is plotted against each conformer evaluated. (A) The sensitivity values for 10 proteins with predicted critical residues close to the ligand showed significantly higher values when the protein was associated to a ligand (red squares) than the corresponding protein structures without the ligand (black squares). (B) As in (A), but here 10 proteins are shown for which the predicted critical residues were not close to the ligand. To facilitate visual analysis in (A) and (B), the points of each group were sorted in ascending order according to their sensitivity value. (C) 1CIP, Guanine nucleotide-binding protein in complex with a GTP analogue, is an example of a protein where the predicted critical residues were close to the ligand. (D) 2RKM, Oligopeptide-binding protein in complex with Lys-Lys peptide, is an example of a protein where the predicted critical residues were not close to the ligand. In (C) and (D) the ligand is in yellow, the protein in green, and the critical residues in purple.

