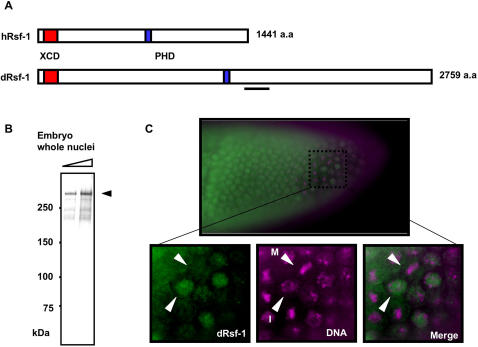
Figure 1. Characterization of dRsf-1.
(A) Schematic comparison between human and Drosophila Rsf-1. These proteins contain the XCD (red box) and PHD (blue box) in the same order. The bar indicates the region against which antibodies were raised. (B) Immunoblot of embryonic nuclear proteins probed with affinity-purified anti-dRsf-1 antibodies. The antibodies specifically recognize a 300 kDa dRsf-1 protein. (C) Staining of embryos with the antibodies against dRsf-1 (green) and DAPI (magenta). Observed was uniform nuclear distribution of dRsf-1 (upper panel). Higher magnification of the embryonic cells (lower panel). White arrowheads show the interphase cell (I) and the metaphase cell (M).

