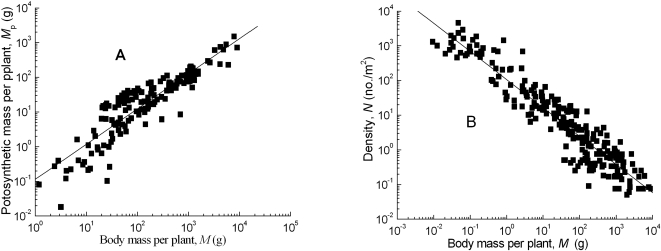
Figure 1. The allometric relationships between photosynthetic mass and body mass (A), and population density and body mass (B) for desert shrubs.
All regressions are significant at P<0.0001 and the 95% CI of the slopes are statistically different from 3/4 and −3/4 (also see Table 1, 2), but the ratio of the two exponents is not statistically different from −1.

