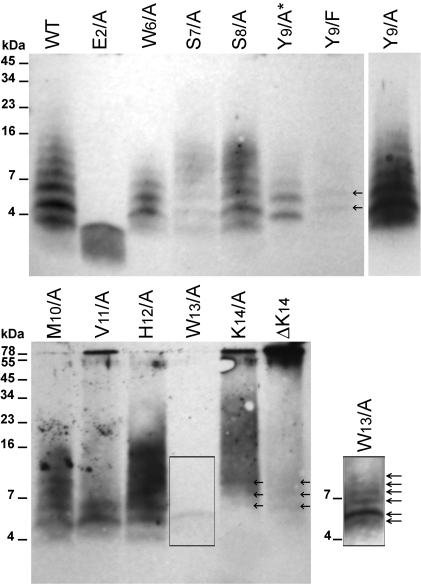
Figure 8. Formation of amyloid oligomers by AChE586-599 and AChE586-599 mutants.
Oligomers of AChE586-599 and AChE586-599 mutants (12 µM) were cross-linked by photo-induced cross-linking. Cross-linked products were resolved (16.5% Tris-Tricine SDS-PAGE), electro-blotted onto nitrocellulose and probed with Mab 105A (specific for AChE586-599 in β-sheet conformation). Marker proteins are indicated. Arrows indicate low abundance oligomeric species. Due to the strength of the signal for the oligomeric species, Y9/A was loaded at a third of the amount of the other peptides (Y9/A*). The signal resulting from loading equal amount to the other peptides can be seen on the individual lane on the right hand side of the top panel (Y9/A). On the right hand side of the bottom panel, an overexposure of the signal for W13/A shows multiple oligomeric species not seen at normal exposure.

