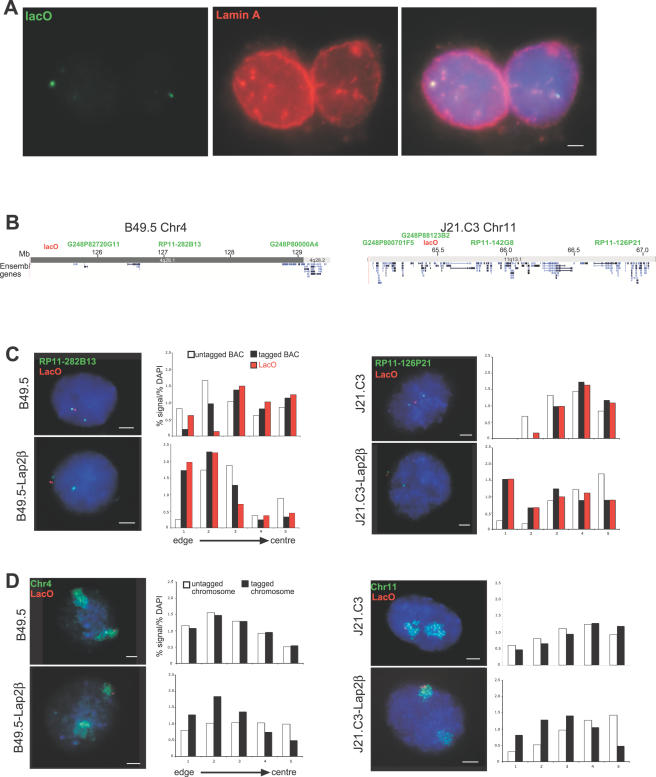
Figure 2. Subnuclear Localisation of lacO-Tagged Chromosomes.
(A) 3D immuno-FISH on B49.5 cells expressing lacI fused to an INM protein, using a DNA probe for lacO and antibody detecting Lamin A. The single image plane shows lacO signals co-localised with foci of lamin A that are at invaginations of the nuclear envelope. Scale bar = 2 µm. (B) Approximate sites of lacO integration (red), determined from interphase FISH with genomic clones (green), on chromosomes 4 and 11 in cell lines B49.5 and J21.C3, respectively. Map position and location of genes is taken from the March 2006 (NCBI Build 36.1) Assembly of the human genome at UCSC (http://genome.ucsc.edu/cgi-bin/hgGateway). Details of clone positions are given in Table S1. (C) Interphase FISH with probes for lacO (red) and neighbouring BAC clones (green) in (top row) lacO tagged cell lines B49.5 and J21.C3 and (bottom row) these same cells lines now expressing lacI-lap2β. Scale bars = 2 µm. To the immediate right of each FISH image the histograms quantify the mean proportion of probe hybridisation signal, normalised to the proportion of DAPI stain (y axis), across the 5 concentric shells eroded from the periphery (shell 1) through to the centre (shell 5) of the nucleus (x axis), for the proximal BAC on the untagged chromosome (open bars) and on the tagged chromosome (black bars) and the lacO sites (red bars) in each of the parental and lacI-lap2β expressing cell lines. n = 35–50 for each cell line. (D) as in (C) but using probes for lacO (red) and chromosome paints (green).

