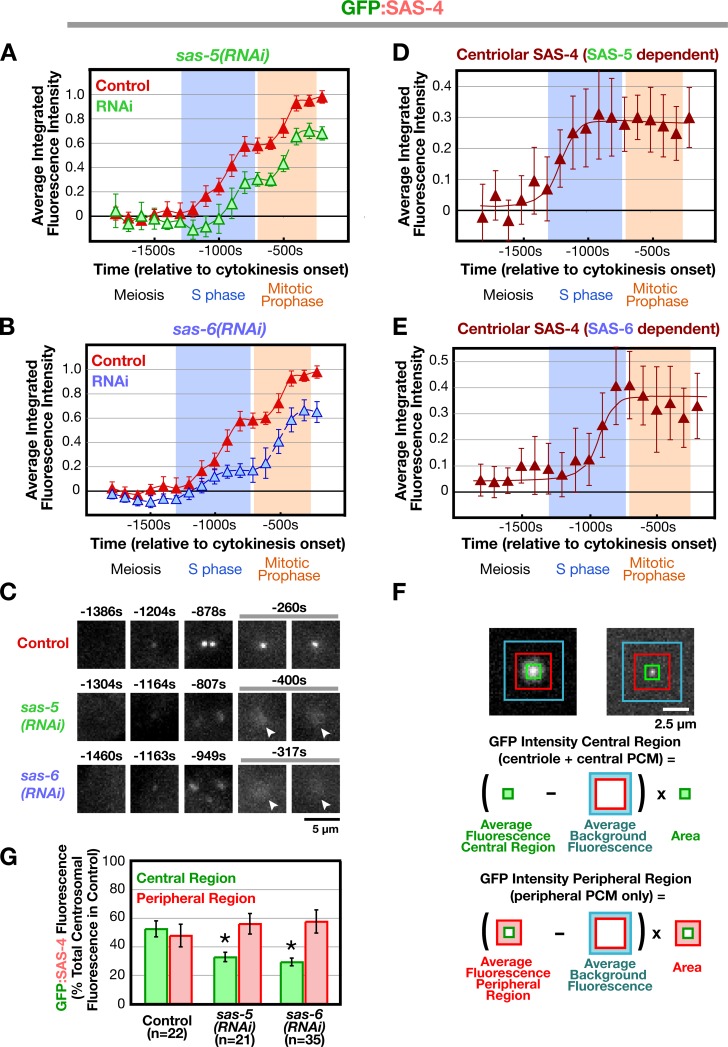
Figure 3.
Deconvolving centriolar- and pericentriolar material–associated SAS-4 recruitment by comparison of control and sas-5/sas-6(RNAi) embryos. (A and B) Kinetic profiles for the recruitment of GFP:SAS-4 in control, sas-5(RNAi) (A), and sas-6(RNAi) (B) embryos. Data points are the mean of the normalized GFP intensity of measurements collected during the 200-s interval centered on that point. (C) High-resolution images of GFP:SAS-4 recruited to RFP-labeled sperm centrioles under the indicated conditions. Times (in seconds relative to cytokinesis onset) correspond to meiosis (−1,460 to −1,304 s), early (−1,204 to −1,163 s) and mid (−949 to −878 s) S phase, and late prophase (−400 to −260 s). Note that, although GFP:SAS-4 is not enriched at centrioles in SAS-5– or SAS-6–depleted embryos, it still accumulates in the PCM (arrowheads). Levels of centriolar GFP:SAS-4 were calculated by subtracting the PCM signal, measured in either sas-5(RNAi) (D) or sas-6(RNAi) (E) embryos, from the combined centriole and PCM signal measured in control embryos. (F) Outline of the method used to measure the distribution of GFP:SAS-4 within the centrosome. A pair of high-resolution images of prometaphase/metaphase centrosomes from embryos expressing GFP:γ-tubulin (left) or a GFP centriole marker (right) illustrate how the centrosome was partitioned into central and peripheral regions by concentric boxes. A 7 × 7 pixel central box (green) includes the signal from the centrioles as well as the central PCM, a larger 18 × 18 pixel box (red) includes the peripheral PCM, and the largest 30 × 30 pixel box (blue) was used to measure the background. (G) Depletion of SAS-5 or SAS-6 specifically affects centriolar recruitment of SAS-4. The distribution of GFP:SAS-4 within the centrosome was quantified in prometaphase/metaphase embryos, when PCM recruitment is maximal. Integrated GFP:SAS-4 fluorescence in the central and peripheral regions, expressed as a percentage of the mean total centrosomal fluorescence (central + peripheral) in control embryos, is plotted for the indicated conditions. Asterisks denote statistically significant differences relative to control (P < 0.05 by t test). All error bars indicate the 90% confidence interval.

