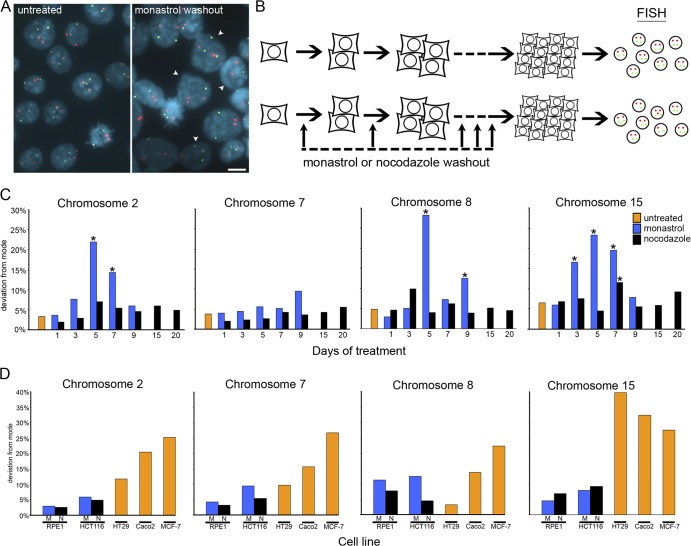
Figure 2.
CIN analyses.(A) Examples of FISH data from HCT116 colonies that were either untreated or subjected to recovery from monastrol-induced mitotic delay (monastrol washout) every third division during colony growth as indicated. Cells were fixed and stained with DAPI (blue) to visualize nuclei and with probes specific for centromeric α-satellite DNA of chromosomes 7 (green) and 8 (red). Arrowheads identify nuclei in which one or both chromosomes deviate from the modal number of two. Bar, 20 μm. (B) Cells were isolated by mitotic shake-off, plated at low density, and grown for several generations to form individual colonies with (bottom) or without (top) recovery from monastrol or nocodazole treatment sequentially for various numbers of cell divisions during colony growth. After ∼30 generations, cells were harvested, and interphase nuclei were labeled with centromere-specific FISH probes. (C) Percentage of nuclei that display deviation from the modal chromosome number of two for four different chromosomes in representative single colonies of HCT116 cell clones that were untreated or subjected to recovery from monastrol- or nocodazole-induced mitotic delay for various days during colony growth (data for all clones can be found in Table S2, available at http://www.jcb.org/cgi/content/full/jcb.200712029/DC1). *, P < 0.05, χ2 test. (D) Percentage of nuclei that display deviation from the modal chromosome number (chromosomal modes for each cell line are provided in Table S1) for four different chromosomes in representative single colonies in the untreated CIN cell lines HT29, Caco2, and MCF-7 (data for all clones can be found in Table S4); RPE-1 cells subjected to recovery from monastrol- or nocodazole-induced mitotic delay for 25 consecutive days (data for all clones can be found in Table S3); or HCT116 cells subjected to recovery from monastrol-induced mitotic delay for nine consecutive days or nocodazole-induced mitotic delay for 20 consecutive days (data for all clones can be found in Table S2).

