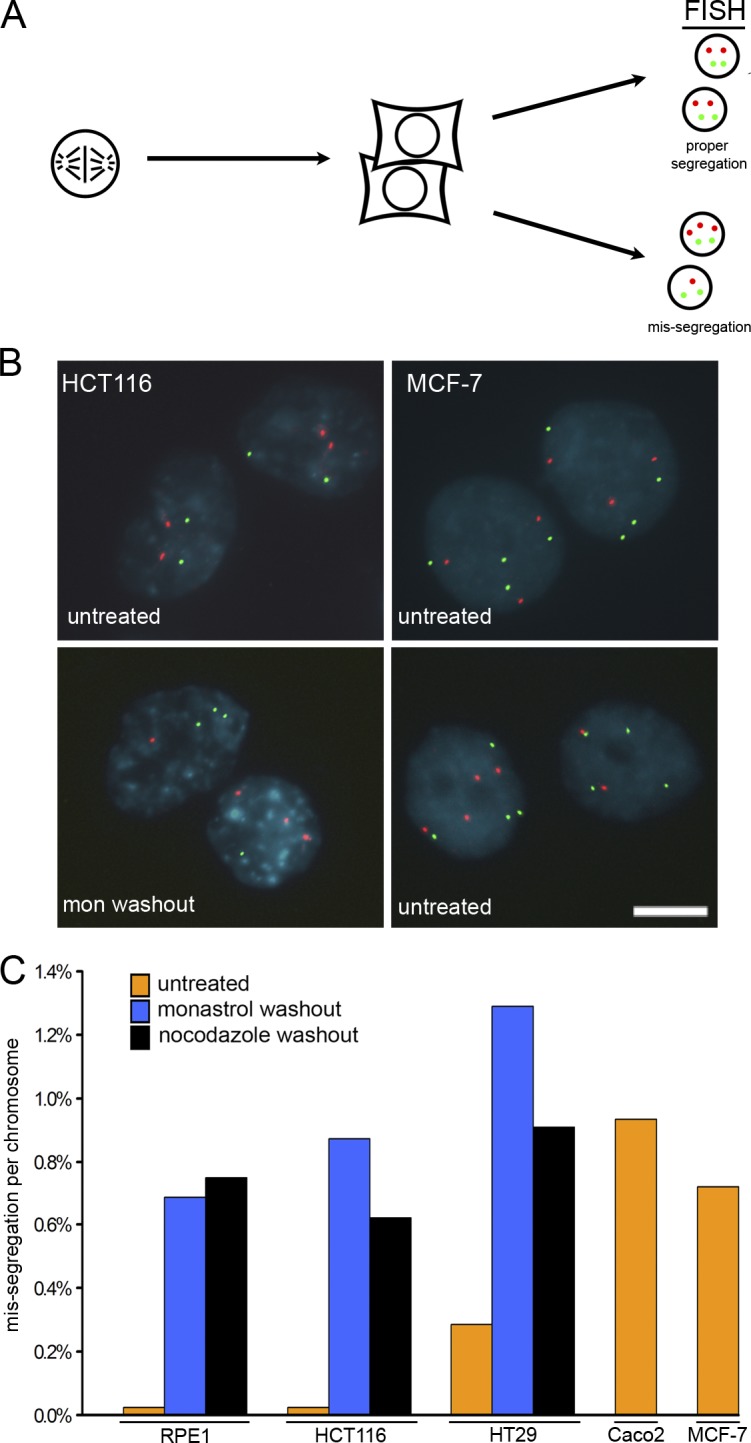
Figure 3.

Chromosome missegregation analysis. (A) Mitotic cells were harvested by mitotic shake-off, plated at low density on slides, and allowed to complete mitosis. Daughter cells were fixed and stained with DAPI (blue) to visualize nuclei and with probes specific to centromeric α-satellite DNA (FISH). (B) FISH for chromosomes 7 and 8 are shown for HCT116 and MCF-7 cells and show normal segregation (top) and missegregation (bottom). Bar, 10 μm. (C) Mean missegregation rate per chromosome for no fewer than two chromosomes in RPE-1 cells (untreated, n = 4,300; monastrol recovery, n = 2,620; nocodazole recovery, n = 2,602), HCT116 cells (untreated, n = 4,000; monastrol recovery, n = 2,640; nocodazole recovery, n = 2,660), HT29 cells (untreated, n = 2,680; monastrol recovery, n = 2,640; nocodazole recovery, n = 2,640), Caco2 cells (n = 1,023), and MCF-7 cells (n = 2,002) as indicated. Percentages have been corrected for modal chromosome number in each cell line (chromosomal modes for each cell line are provided in Table S1, available at http://www.jcb.org/cgi/content/full/jcb.200712029/DC1).
