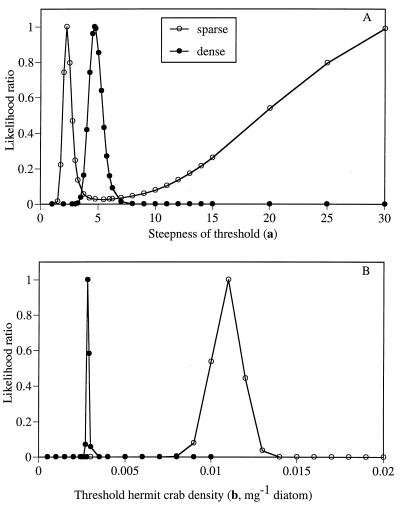
Figure 2.
Likelihood profiles for parameters in the Weibull function used to describe the relationship between hermit crab density and proportion of diatoms remaining. Likelihood ratios normalize all values relative to the maximum likelihood. (A) Threshold steepness (a) when b is unfixed. (B) Threshold hermit crab density (b) when a is unfixed. The cutoff values for 95% confidence intervals around the maximum likelihood occur at a likelihood ratio of 0.15.

