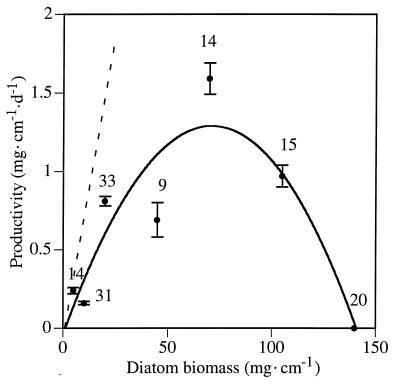
Figure 4.
Productivity of Isthmia nervosa inside containers (mg⋅d−1 on each cm of host Odonthalia; mean ± SE). Sample sizes are presented above each mean value. Although the graph excludes trials in which diatoms declined, incorporating those trials simply shifts the relationship between diatom biomass and productivity lower, rather than changing its shape. The second order regression using mean productivity is significant (y = −0.042 + 0.038x − 2.646·10−4x2; F = 8.725, P = 0.0348, n = 7). Division rates (r) also were measured in the laboratory (October 8–14, 1994, 16 h light:8 h dark, 10–15°C, in autoclaved seawater with added Provasoli’s Enrichment Solution and metasilicate). This (maximum) division rate is shown by the dashed line: r = 0.075 div⋅d− 1 ± 0.0079 SE, n = 33.

