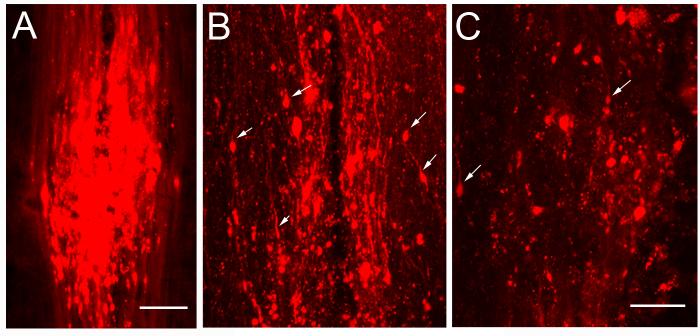
Figure 3. Longitudinal Images show the CST damage in the spinal dorsal funiculus.
A typical CST lesion site in the spinal cord was indicated with DiI leakage in a MCID image (A). The DiI-labeled axons were decreased caudal to the lesion site. In a single layer confocal image of the CST lesion site, blobs of leaked DiI show the axonal damage site (Arrows in B). In a more caudal lesion site, only few intact axons were labeled (C). The images are oriented with rostral at the top. Scale Bars in A = 250 μm, B and C = 25 μm.

